Key Takeaways: Microsoft Fabric vs Power BI
- Power BI stays: Microsoft is retiring Premium P SKUs, not Power BI. Pro, PPU, and existing reports continue.
- Licensing model: Power BI charges per user, while Fabric charges for shared compute capacity.
- F64 break-even: Free-license viewers are supported on F64 or above. Smaller capacities still require paid viewer licenses.
- Authors need licenses: Report creators still need Pro or PPU, even when using Fabric capacity.
- When to move: Choose Fabric when data integration, growing viewer numbers, or expiring P SKU contracts justify it.
| Your situation | Best fit |
|---|---|
| One or two clean data sources and fewer than 358 viewers | Power BI Pro or PPU |
| 358+ view-only users or an upcoming P SKU renewal | Fabric F64 or above |
| Data spread across CRM, ERP, and spreadsheets | Fabric with Power BI |
| Small team testing data workloads | F2 to F32, plus Pro licenses |
| Users already have Pro through Microsoft 365 E5 | Power BI, unless Fabric workloads are needed |
Two revenue reports show different numbers, but both teams insist their data is correct. At the same time, Power BI licensing costs keep rising as more employees need access. Now the question is whether adding Microsoft Fabric will solve these problems or create another expense.
The Microsoft Fabric vs Power BI decision goes beyond choosing a reporting tool. Power BI already works as the reporting layer within Fabric, while Fabric adds data engineering, storage, analytics, and shared capacity.
Understanding this difference is essential before comparing Power BI Pro pricing, Microsoft Fabric pricing, and the cost of running both.
In this guide, you’ll learn:
- How Power BI and Fabric differ across 12 buying criteria
- How per-user licenses compare with Fabric capacity pricing
- Where the F64 break-even point makes capacity worth considering
- How Dynamics 365 data connects with Fabric
- When to move to Fabric capacity, including what happens when a P SKU term ends and an 8-step migration plan
By the end of this guide, you’ll know which option fits your reporting, what it could cost, and whether moving to Fabric makes sense.
Microsoft Fabric and Power BI: What Each One Is and How They Relate
Power BI helps teams create reports and dashboards, while Microsoft Fabric manages the wider data process, from collecting and preparing data to reporting. Both work together, but they serve different purposes.
What Is Power BI?
Power BI is Microsoft’s business intelligence tool for creating reports, dashboards, and data models. Teams build reports in the free Power BI Desktop. They share them through the Power BI service, which needs a Pro or Premium Per User license.
Its semantic models manage data relationships, DAX measures, and row-level security to keep reports accurate and consistent. Power BI also supports data preparation through Power Query and dataflows, along with paginated reports, mobile apps, and Power BI Report Server for on-premises reporting.
What Is Microsoft Fabric?
Microsoft Fabric is a cloud-based analytics platform that brings data integration, engineering, warehousing, data science, real-time analytics, databases, and Power BI into one environment. Each workload handles a different part of the data process.
All these workloads use OneLake, a shared data lake built on Azure Data Lake Storage Gen2, as explained in Microsoft’s Fabric overview. Fabric uses capacity-based pricing, where different workloads share the same pool of capacity units.
Fabric runs entirely in Microsoft’s cloud and does not have an on-premises edition. Businesses that need on-premises reporting can continue using Power BI Report Server. F64 and larger reserved capacities also include Report Server rights.
Is Microsoft Fabric Replacing Power BI?
No, Power BI is still available as a standalone product and remains the reporting workload within Microsoft Fabric. Businesses can continue using Power BI without purchasing Fabric capacity.
Microsoft is retiring Power BI Premium per-capacity SKUs, from P1 to P5, not Power BI itself. According to Microsoft’s Premium migration guidance, new P SKU purchases are no longer available, and existing subscriptions continue until their current agreement terms end.
Power BI Pro and Premium Per User licenses are not affected by this retirement. The Microsoft Fabric vs Power BI decision comes down to one question: do you need reporting alone, or a wider platform with shared capacity?
Microsoft Fabric vs Power BI: How They Compare on 12 Buying Criteria
Power BI is simpler and often costs less for focused reporting. Fabric offers more when teams need data engineering, shared capacity, real-time analytics, or AI across multiple data sources.
| Criteria | Power BI (Pro or PPU) | Microsoft Fabric (F SKU capacity) |
|---|---|---|
| What you buy and list price | Pro: $14/user/month. PPU: $24/user/month, paid yearly. | Capacity starts at $262.80/month for F2 on pay-as-you-go. |
| Who needs a paid license | Every report author and viewer needs a license. | Authors need licenses. Viewers need one below F64. |
| Where the work starts | At the semantic model, once data is ready. | At the source, covering data preparation through reporting. |
| Data storage | Import, DirectQuery, or composite models. | OneLake storage in Delta Parquet, with Direct Lake for reporting. |
| Workloads included | Reports, dashboards, paginated reports, and dataflows. | Power BI, Data Factory, Data Engineering, Data Warehouse, Data Science, Real-Time Intelligence, and Databases. |
| Dynamics 365 and Dataverse data | Uses connectors and imports data into individual models. | Link to Fabric places Dataverse tables in OneLake without ETL. |
| Real-time data | Uses scheduled refresh or DirectQuery. | Real-Time Intelligence supports streams and events. |
| Governance and security | Workspace roles, row-level security, and sensitivity labels. | Includes these controls, plus Azure network options such as managed private endpoints. |
| Copilot and AI | Copilot needs paid Fabric capacity (F2 or larger) or Premium P1 or above. Pro or PPU alone isn’t enough. | Copilot and data agents are available on paid F2 or larger capacities. |
| Admin and skills | Needs report authors with DAX and data modeling skills. | Also needs capacity administration, data engineering, and cost monitoring. |
| Scaling and billing | Costs increase with the number of licensed users. | Capacity can be resized on demand and is billed through Azure at regional rates. |
| Best fit | Departmental reporting and self-service analytics using clean data sources. | Multiple data sources, large viewer groups, and AI on governed data. |
These are Microsoft US list prices for the Microsoft Fabric vs Power BI comparison, and they vary by region, currency, and licensing agreement.
Microsoft Fabric vs Power BI Pricing: What Does Each Cost?
Power BI charges per user, while Fabric charges for shared computing capacity. The difference affects your monthly bill, especially as more people use reports and your data workloads grow.
Power BI Pro pricing starts at $14 per user/month, while Premium Per User costs $24. Microsoft Fabric pricing starts at $262.80/month for F2 on pay-as-you-go, or $156.33 with a 1-year reservation, before storage and other charges.
1. Power BI Per-User Licenses: Free, Pro and Premium Per User
Power BI licensing depends on how many people create and view reports, so costs increase as you add users. The following are Microsoft’s published US list prices, billed yearly.
| License | List price | Model memory | Refreshes per day | What it gives you |
|---|---|---|---|---|
| Free | $0 | Personal use only (no sharing) | Personal use only (no sharing) | Build reports in Desktop and view shared content on F64 or larger |
| Pro | $14 per user a month | 1 GB | 8 | Publish, share, and create reports on any capacity |
| Premium Per User | $24 per user a month | 100 GB | 48 | Premium features per user. Every viewer of PPU content also needs PPU |
Microsoft increased Pro from $10 to $14 and Premium Per User from $20 to $24, so older budgets may underestimate licensing costs. Pro is also included in Microsoft 365 E5 and Office 365 E5, so check existing licenses before purchasing additional seats.
2. Fabric Capacity Pricing: F2 to F2048
Fabric capacity pricing depends on the number of capacity units (CUs) you purchase and how long the capacity runs. In US West 2, pay-as-you-go costs $0.18 per CU-hour, based on Microsoft’s Fabric pricing page.
| SKU | Capacity units | Pay-as-you-go per month | 1-year reservation per month | Free-license viewers |
|---|---|---|---|---|
| F2 | 2 | $262.80 | $156.33 | No |
| F4 | 4 | $525.60 | $312.67 | No |
| F8 | 8 | $1,051.20 | $625.33 | No |
| F16 | 16 | $2,102.40 | $1,250.67 | No |
| F32 | 32 | $4,204.80 | $2,501.33 | No |
| F64 | 64 | $8,409.60 | $5,002.67 | Yes |
| F128 | 128 | $16,819.20 | $10,005.33 | Yes |
| F256 | 256 | $33,638.40 | $20,010.67 | Yes |
| F512 | 512 | $67,276.80 | $40,021.33 | Yes |
| F1024 | 1,024 | $134,553.60 | $80,042.67 | Yes |
| F2048 | 2,048 | $269,107.20 | $160,085.33 | Yes |
Monthly prices assume 730 hours, and larger SKUs up to F8192 follow the same per-unit rate. A 1-year reservation saves 40.5% compared with pay-as-you-go, but it is a prepaid commitment. Pausing a reserved capacity does not reduce the reservation charge.
3. Storage, Overage and Other Charges Outside the SKU Price
Fabric capacity pricing covers compute, not every cost of running the platform. Include these seven additional charges when estimating your total Microsoft Fabric licensing and operating costs, so your Microsoft Fabric vs Power BI comparison is fair.
- OneLake storage: Hot data costs $0.023 per GB/month in US West 2, billed separately from capacity.
- Mirroring storage: Each capacity unit includes 1 TB of free mirroring storage. An F64 capacity therefore includes 64 TB, according to Microsoft’s mirroring documentation.
- Capacity overage: Overage billing helps prevent throttling but costs three times the normal capacity rate. Set a spending limit and assign someone to monitor usage.
- Dataverse storage: Linking to Fabric creates a data replica that uses Dataverse database storage. Your Dynamics 365 storage allowance must account for it.
- Paused capacity: Pausing stops compute billing, but any smoothed usage still owed is added to your Azure bill when you pause.
- Copilot usage: Copilot and AI features consume capacity units at the same $0.18 per CU-hour rate. Heavy AI workloads can therefore compete with report workloads for capacity.
- Implementation and skills: Data migration, pipeline development, capacity sizing, reconciliation, and team training are not included in Microsoft’s license or capacity prices. Budget for these separately.
Seats or Capacity: When Does Fabric Cost Less Than Power BI Pro?
In the Microsoft Fabric vs Power BI cost comparison, the difference depends on how many people create reports and how many only view them. A reserved F64 costs less than Pro licenses once you pass around 358 view-only users, compared with 601 on pay-as-you-go.
The 5 Licensing Rules That Decide Your Bill
Fabric capacity does not replace every Power BI license. These five rules determine when you still need individual licenses, based on Microsoft’s Fabric licensing rules.
- Free viewing starts at F64: Users can view Power BI content without a paid license on F64 or larger, with the Viewer role.
- F2 to F32 still need licenses: Viewers need Pro, PPU, or a trial, so you pay for both capacity and seats.
- Authors always need a license: Report creators and publishers need Pro or PPU on every capacity size.
- E5 users may already have Pro: Microsoft 365 E5 and Office 365 E5 include Pro, so check existing licenses before buying more.
- PPU suits smaller premium teams: Microsoft identifies PPU as a cost-effective option when fewer than 250 users need Premium features.
The F64 Break-Even Point
In the Microsoft Fabric vs Power BI break-even calculation, authors need Pro either way, so the answer depends on view-only users. Divide the F64 monthly price by $14 to find how many Pro seats cost the same.
A reserved F64 costs $5,002.67 per month, equal to about 358 Pro seats. Pay-as-you-go costs $8,409.60, equal to about 601 seats.
Fabric also includes capacity for data pipelines, engineering, and warehousing. If your team needs these workloads, the value can go beyond replacing viewer licenses.
Worked Scenarios at 60, 400 and 1,500 Users
These examples compare Microsoft Fabric vs Power BI costs using US list prices, a reserved F64, and Pro licenses for authors.
| Organization | Authors | Viewers | Pro for everyone a month | F64 reserved plus author Pro | Verdict |
|---|---|---|---|---|---|
| Finance and operations team | 15 | 45 | $840 | $5,212.67 | Stay on Pro |
| Mid-market company | 40 | 360 | $5,600 | $5,562.67 | Near break-even |
| Enterprise rollout | 100 | 1,400 | $21,000 | $6,402.67 | Saves about $9,600 (F128) to $14,600 (F64) a month |
A 60-user team can add an F2 reservation for $156.33 per month and retain Pro for everyone, bringing the estimated total to $996.33. A 1,500-user rollout may need F128 for performance. Even with author licenses, the cost is $11,405.33 per month.
PPU can still suit smaller teams. For example, 200 PPU licenses cost $4,800 per month, compared with $5,702.67 for a reserved F64 and 50 Pro author licenses. However, every viewer of PPU content needs a PPU license, which can make it expensive for teams with many viewers.
Sitting near the 358-viewer line, or close to a P SKU renewal? Powercret’s Analytics maturity assessment maps your authors, viewers, data sources, and capacity use, then shows the most cost-effective license mix. Start a Conversation about yours.
What Actually Changes When Your Reports Move to Fabric Capacity
For teams weighing Microsoft Fabric vs Power BI, most reports continue working after the move to Fabric. The main changes are in Azure billing, capacity management, and how reports access data.
1. What Carries Over Without Rework
Moving from Power BI to Fabric does not mean rebuilding your reports. Semantic models, dashboards, workspace apps, deployment pipelines, and Git integration continue working on Fabric capacity. Refresh schedules also carry over, although an active refresh may be interrupted during reassignment.
Pro workspaces can move by changing their assigned capacity in workspace settings, without moving the reports or models themselves.
Most migration work happens behind the reports. Teams need to review capacity settings, gateways, and data sources to make sure everything continues running correctly.
2. What Changes for IT and Finance
Once your Microsoft Fabric vs Power BI choice lands on capacity, billing and admin move from the Microsoft 365 admin center to Azure. IT and finance teams need to account for five important changes.
- Azure billing: F SKUs use Azure pay-as-you-go or reservations, with prices based on the selected region.
- No autoscale: F SKUs do not support P SKU autoscale. You must resize capacity manually or use capped overage.
- Smoothing: Fabric spreads interactive usage over 5 to 64 minutes and background jobs over 24 hours, helping manage short usage spikes.
- Throttling: After 10 minutes of borrowed capacity, interactive jobs wait 20 seconds. After 60 minutes, Fabric rejects them, according to Microsoft’s throttling rules.
- Azure-only controls: Managed private endpoints, trusted workspace access, Azure Monitor, and Microsoft Cost Management are available with F SKUs.
3. Direct Lake, Import, or DirectQuery: How Reports Read Data on Fabric
Direct Lake is one of the biggest changes for report authors. It reads Delta tables directly from OneLake instead of copying data into a semantic model, making it useful for large datasets.
| Storage mode | Where the data sits | Refresh | Best for |
|---|---|---|---|
| Import | A copy inside the semantic model | Scheduled, up to 8 times daily on Pro and 48 on PPU | Small and mid-sized models with stable sources |
| DirectQuery | In the source system | No import refresh. Each visual queries the source | Live data, where slower visuals may be a trade-off |
| Direct Lake | Delta tables in OneLake | Metadata update, known as framing | Large models running on Fabric capacity |
Direct Lake requires Fabric capacity and has row limits based on the SKU. F2 and F8 support 300 million rows per table, while F64 supports 1.5 billion, according to Microsoft’s Direct Lake documentation.
If a Direct Lake on SQL model exceeds its limits, it falls back to DirectQuery, which can slow report performance. Direct Lake on OneLake instead stops refreshing until the Delta tables are optimized to meet the limits.
These differences matter when evaluating Microsoft Fabric vs Power BI, especially if your reports depend on large datasets or frequent updates.
Now that you’ve seen what changes for your team, let’s look at how Dynamics 365 and Business Central data reaches Fabric.
Running Dynamics 365 or Business Central? How Your Data Reaches Fabric
Dynamics 365 and Business Central connect to Microsoft Fabric in different ways. Dataverse uses a direct link to OneLake, while Business Central uses mirroring. Both help bring business data into one place for reporting and analysis.
1. Link to Fabric for Dataverse and Dynamics 365 Apps
The Link to Microsoft Fabric feature connects Dataverse data directly to OneLake without traditional ETL. It creates a lakehouse, SQL endpoint, and Power BI semantic model, with changes synced automatically.
It requires Fabric capacity or Power BI Premium and the System Administrator role. Review the selected tables before enabling it, as each table adds storage usage. For a better understanding, see how we approach Dataverse architecture.
2. Business Central Mirroring to Fabric
Business Central mirroring copies selected company data into Fabric as Delta Parquet files. It starts with a snapshot and then syncs incremental changes.
You can select up to 1,000 tables. Replication compute does not consume Fabric capacity, but querying the data does. The feature is currently in preview, so check the Business Central documentation for current availability and limits.
3. When Power BI Alone Still Covers Dynamics 365 Reporting
For Dynamics 365 teams, the Microsoft Fabric vs Power BI answer is often Power BI alone, if you report from one Dataverse environment. Its Dataverse connector can handle many reporting needs without adding Fabric.
Fabric becomes more useful when you need to combine Dynamics 365 data with Business Central, legacy ERP systems, spreadsheets, or IoT data. For example, a service director can compare Customer Service cases with Business Central invoices in one reporting environment.
Also Read: How to Decide Whether to Rescue a Stalled Dynamics 365 Implementation
Power BI Alone or Fabric? Signals and a 10-Question Self-Audit
Stay with Power BI if your reports work, and your data is already organized. Consider Fabric when data silos, refresh limits, or growing viewer costs become bigger problems.
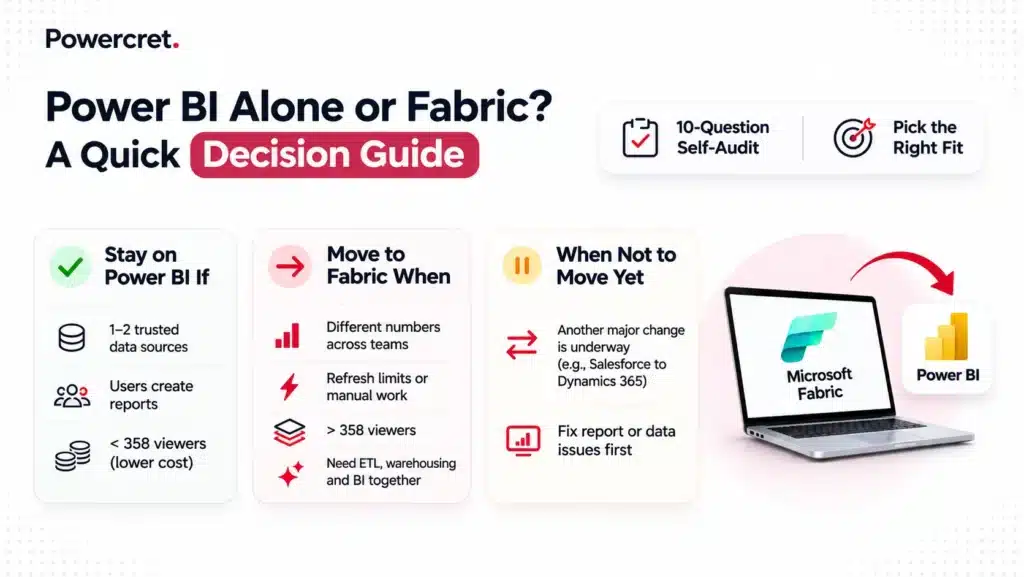
Stay on Power BI Alone If
Your data comes from one or two reliable sources, your warehouse already works, and most users create reports rather than just view them.
A Microsoft Fabric vs Power BI cost check also favors Pro while your view-only audience stays below about 358 users. Stay with Power BI if nobody is available to manage capacity.
Move to Fabric When
Teams report different numbers, manual data reconciliation takes time, or Import refreshes keep missing their windows.
Fabric is also worth considering when you have more than 358 view-only users, need near-real-time reporting, or want to combine ETL, warehousing, and BI. An upcoming P SKU renewal or plans for Copilot and data agents can also make the move timely.
When Not to Move Yet
Put the Microsoft Fabric vs Power BI decision on hold if another platform change is underway, such as a Salesforce to Dynamics 365 migration. Finish the data changes first.
The three things clients underestimate in a Salesforce to Dynamics 365 migration explain why this work needs proper planning.
Also, do not move just to fix poorly designed reports. Fabric cannot fix a weak semantic model or incorrect data. Address those problems before investing in capacity.
The 10-Question Self-Audit
Answer yes or no to each question. Count your yes answers for questions 1 to 9. Question 10 checks whether you’re ready.
- Do teams report different numbers for the same metric?
- Do more than 358 people only view reports?
- Does your P SKU term end within the next 12 months?
- Do Import refreshes exceed their scheduled windows?
- Do reports need data fresher than scheduled refreshes allow?
- Do you use separate tools for ETL, warehousing, and BI?
- Do you need to combine Dynamics 365 data with other systems?
- Are you planning to use Copilot or data agents on business data?
- Do most of your viewers need to buy Power BI Pro because they don’t get it through Microsoft 365 E5?
- Is someone responsible for capacity sizing and costs?
Five or more yes answers in questions 1 to 9 suggest that Fabric deserves a closer look. Build a cost plan before making the move. If question 10 is a no, assign a capacity owner first.
The answers help settle the Microsoft Fabric vs Power BI decision. Now that you know which side of the line you are on, let’s look at when and how to move without breaking a report.
When to Move: The Premium Renewal Deadline and a Safe Migration Sequence
If you use a P SKU, plan your move before its term ends. Pro-only teams can move when their reporting needs and capacity costs justify it.
What Happens When Your P SKU Term Ends
Microsoft’s P SKU to F SKU decision guide explains what happens when a Premium subscription expires. The 30-day grace period is not a planned migration window, so move and validate your workspaces before the term ends.
| Period | What happens | What you should do |
|---|---|---|
| Before the term ends | P SKU runs normally | Buy F SKU, reassign workspaces, and validate |
| Days 1 to 30 | Current capacity continues at no charge | Finish workspace reassignment |
| Days 31 to 90 | Access is throttled, and interactive operations are delayed | Expect slower reports |
| Day 91 onward | Operations are rejected. Data remains but is inaccessible | Migrate workspaces or delete the capacity |
Enterprise Agreement customers may renew P SKU capacity annually until their agreement ends. Confirm your contract terms with your Microsoft account team before setting a migration date.
Pro-only teams have no forced deadline. Use the cost and workload comparison above to decide when to move, then migrate one subject area at a time.
An 8-Step Move That Keeps Reports Running
If the Microsoft Fabric vs Power BI decision points to a move, a safe Power BI Premium to Fabric migration starts by measuring usage. Follow these steps to protect reports, data, and user access.
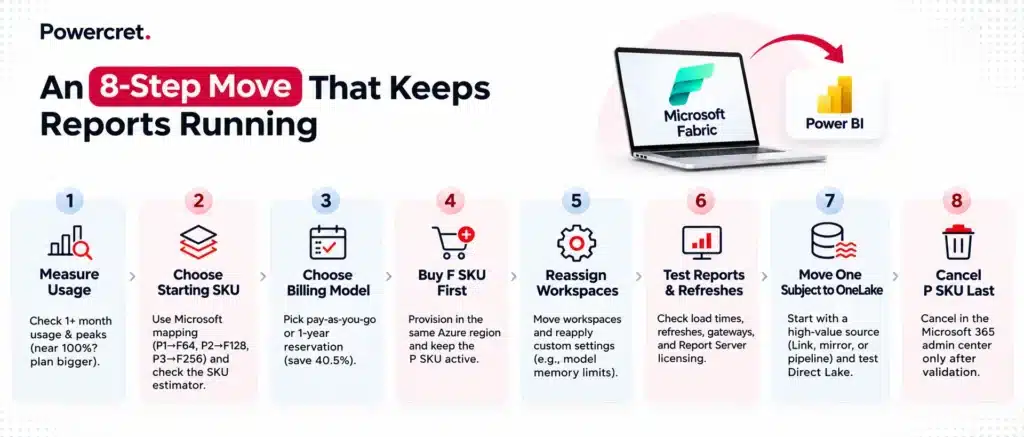
- Measure current usage: Use the Fabric Capacity Metrics app to review at least one month of usage, including month-end peaks. If capacity stays near 100%, plan for an equivalent or larger F SKU.
- Choose the starting SKU: Use Microsoft’s mapping as a baseline: P1 to F64, P2 to F128, and P3 to F256. Then check the Fabric SKU estimator, because compute mapping does not cover licensing rights.
- Choose your billing model: Decide between pay-as-you-go and a 1-year reservation before provisioning. Reservations save 40.5%, while pausing only saves money with pay-as-you-go.
- Buy the F SKU first: Provision it in the same Azure region as your P SKU, unless data residency rules require otherwise. Keep the P SKU active until the new capacity is ready.
- Reassign workspaces and settings: Move workspaces through the Fabric admin portal or Microsoft’s capacity migration notebook. Reapply custom settings, including semantic model memory limits.
- Test reports and refreshes: Check report load times, refresh schedules, gateways, and Report Server licensing. Fix issues while the P SKU is still available as a fallback.
- Move one subject area to OneLake: Start with a high-value source using Link to Fabric, mirroring, or a pipeline. Test a Direct Lake semantic model and compare refresh times and key figures with the existing model.
- Cancel the P SKU last: Fabric does not cancel your old capacity automatically. Cancel it through the Microsoft 365 admin center only after validation. Until then, both capacities may be billed.
Migration Risks and How to Avoid Them
Most Microsoft Fabric vs Power BI migration problems come from poor capacity sizing, workspace moves, or early cancellation. Plan for these five risks before moving production workloads.
| Risk | What breaks | How to avoid it |
|---|---|---|
| Moving across regions | Large models may fail to move, Fabric items can block reassignment, and rebuilt models may get new IDs that break report bindings | Stay in the P SKU’s region unless residency rules require a move |
| Undersized capacity | Month-end peaks delay or reject interactive queries | Size capacity using measured peaks, not the old SKU name |
| Uncapped overage | Overage can cost three times the normal capacity rate | Set an overage cap and assign a capacity owner |
| Linking every Dataverse table | Dataverse storage grows beyond the planned budget | Remove unnecessary tables and monitor storage in the Power Platform admin center |
| Canceling the P SKU early | Reports are throttled after the 30-day grace period, then stop on day 91 | Buy, reassign, and validate the F SKU before canceling |
Why Choose Powercret for Your Power BI and Fabric Move
Choosing between licenses and capacity is only one part of the Microsoft Fabric vs Power BI decision. Getting the capacity right, protecting report accuracy, and connecting Dynamics 365 data to OneLake require the right implementation team.
Powercret is a Microsoft consulting and implementation partner that handles licensing, Fabric setup, and report migration through one team.
What Makes Powercret Stand Out:
- Microsoft expertise, end-to-end: We focus on Microsoft technologies, including Dynamics 365, Power Platform, Power BI, and Fabric.
- Senior consultants on every project: Senior team members stay involved from planning to delivery. Our founders spent more than a decade delivering Microsoft projects at bigger firms.
- Dynamics 365 data integration: We connect Dataverse and Dynamics 365 data to OneLake, reducing the need for custom pipelines.
- Accurate reports after migration: Reports from Excel, SSRS, SSAS, or Synapse go through parallel-run checks and sign-off before cutover.
- Fixed pricing and clear timelines: Get a fixed price range and indicative timeline within 5 business days, before work begins.
- Long-term client relationships: Powercret reports a 98% client retention rate across 7 countries.
Still unsure whether to choose Power BI licenses or Fabric capacity?
Book a free consultation with our experts to get a clear licensing and migration plan for your reporting environment.
What This Means for You
Power BI is still the right choice for focused reporting on clean, reliable data. Fabric makes more sense when you need to combine multiple sources, scale reporting, or prepare for a P SKU renewal.
Before deciding, count your view-only users, check your renewal date, and review the data sources behind your reports. This will help you compare Microsoft Fabric vs Power BI based on actual costs and business needs.
If a Premium term ends within your next budget cycle, start planning early. A Fabric adoption roadmap can help you size capacity, choose between pay-as-you-go and reservation pricing, and plan a phased migration.
Connect with our experts to build your Fabric adoption roadmap. You can receive a fixed-price scoping proposal within five business days if you decide to proceed.